Figure 2.

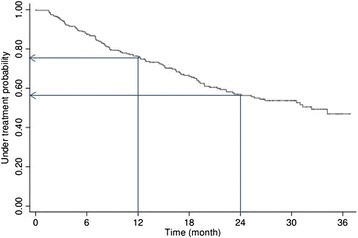
Kaplan-Meier plot illustrating the rate of dropouts. An estimated retention function. Rate of drop-outs during treatment.

Kaplan-Meier plot illustrating the rate of dropouts. An estimated retention function. Rate of drop-outs during treatment.