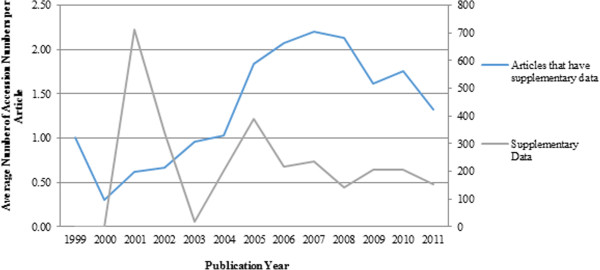
Figure 3.

Distribution of average number of database citations over years. Articles with supplementary data (left axis), Supplementary data (right axis). This figure describes distribution of average number of database citations over years in supplementary data and in the bodies of articles which have supplementary data.
