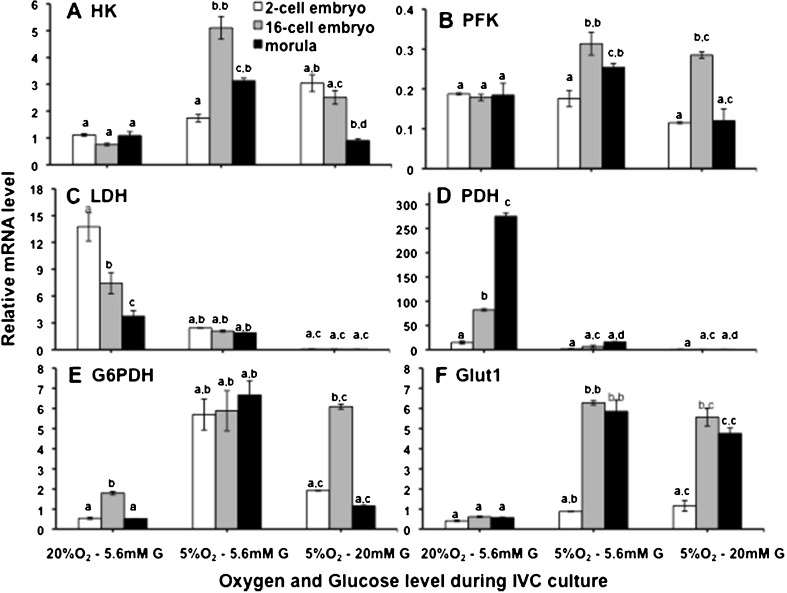
Fig. 2.
Expression pattern of glucose metabolism genes in embryos at different cell stages of preimplantation development (2-cell, 16-cell and morulla). a. HK, b. PFK, c. LDH, d. PDH, e. G6PDH, f. GLUT1. Bars on respective columns represent standard error of mean. The first superscript indicates level of difference between different cell stages within a particular experimental group and the second superscript indicates difference for the same cell stage between different experimental groups. Columns with different superscripts indicate significant difference (p < 0.05)

