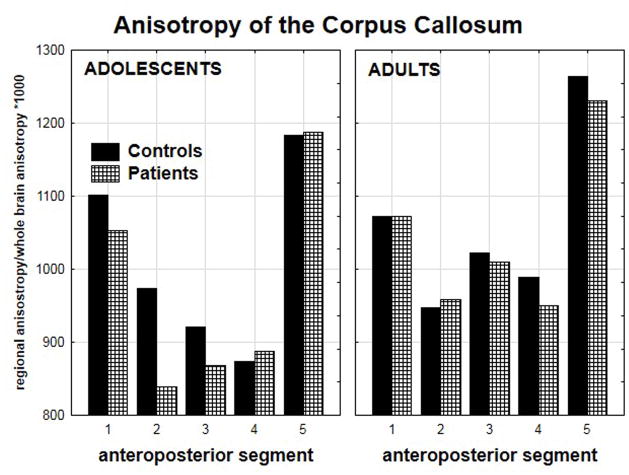
Figure 3.
Mean anisotropy for the anteroposterior segments of the corpus callosum is shown for the four groups (diagnosis × age × anteroposterior segment, F(4,92)=2.50, p<0.05). The adolescents showed reduced anisotropy in the anterior segments whereas the adults showed reduced in the posterior segments. Note that anisotropy values are standardized as a ratio of the mean regional value to mean whole-brain value (×1000).

