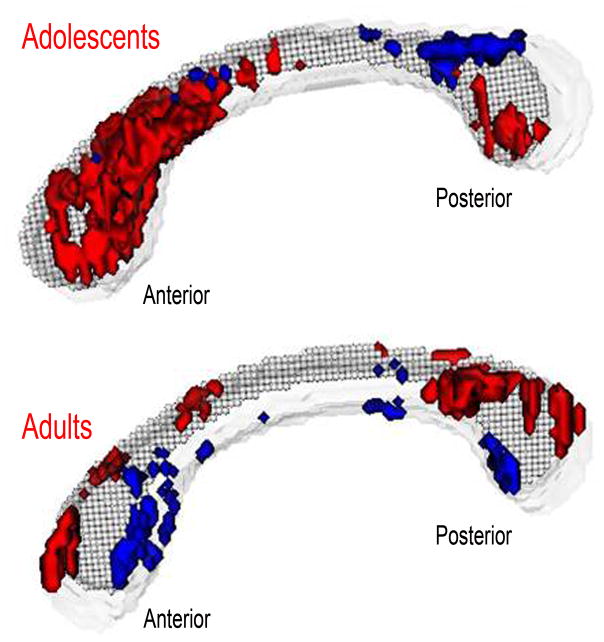
Figure 4.
ROI pixel-by-pixel t-tests. Red indicates significantly higher anisotropy in the healthy controls. Blue indicates significantly higher anisotropy in the patients (p<0.05, t-test, corrected for multiple tests). Top: The adolescent patients showed a marked decrease in anisotropy in the anterior section of the corpus callosum. Bottom: The adult patients demonstrated greater reductions in the posterior section of the corpus callosum.

