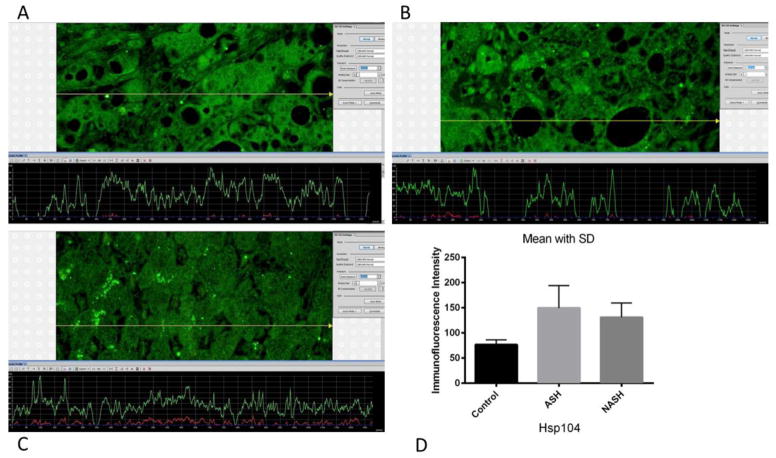
Figure 2.
(A) ASH, (B) NASH and (C) normal control measurements of Hsp104 levels. The presence of Hsp104 was detected by the green immunofluorescence on the liver biopsies. ASH and NASH showed slightly more green fluorescence compared to normal control liver biopsies. More fluorescence corresponded to the increase presence of Hsp104. (D) Means with SD of Hsp104 in ASH, NASH, and normal control liver. Levels of Hsp104 were significantly elevated in ASH (p<0.01) and NASH (p<0.05) compared to normal control. However, ASH and NASH did not show a significant difference from each other in Hsp104 levels. (×566 magnification)

