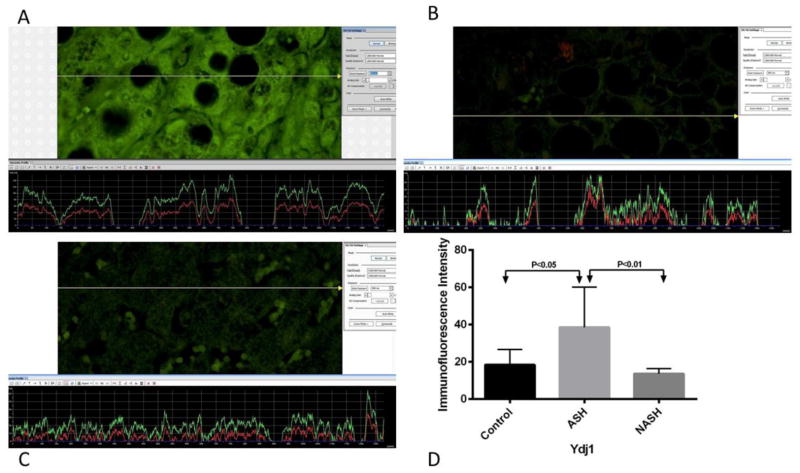
Figure 4.
(A) ASH, (B) NASH and (C) normal control measurements of Ydj1 levels. The presence of Ydj1 was detected by the green immunofluorescence on the liver biopsies. (A) ASH showed brighter green fluorescence compared to (B) NASH and (C) normal control. More fluorescence corresponded to the increase levels of Ydj1. (D) Means with SD of Ydj1 in ASH, NASH, and normal control liver biopsies. Ydj1 was significantly elevated in ASH (p<0.05) compared to normal control liver biopsies. Compared to NASH, Ydj1 was also significantly elevated in ASH (p<0.01). There is no significant difference in the level of Ydj1 between NASH and normal control liver. (×566 magnification)

