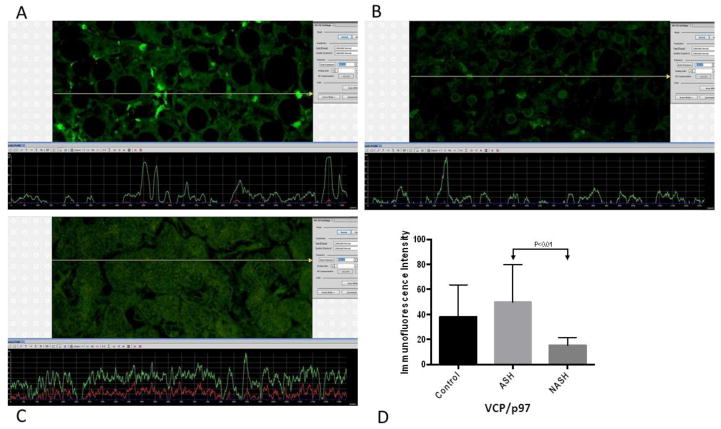
Figure 6.
(A) ASH, (B) NASH and (C) normal control measurements of VCP/p97 levels. The presence of VCP/p97was detected by the green immunofluorescence on the liver snip picture. The level of fluorescence intensity was dependent on the amount of VCP/p97. (A) ASH showed slightly greener fluorescence compared to (B) NASH. More fluorescence corresponded to the elevated levels of VCP/p97. (D) Means with SD of VCP/p97 in ASH, NASH, and normal control liver. VCP/p97levels did not show significant difference between ASH and control, nor between NASH and control. However, comparing ASH versus NASH, VCP/p97is significantly elevated in ASH (p<0.01). (×566 magnification)

