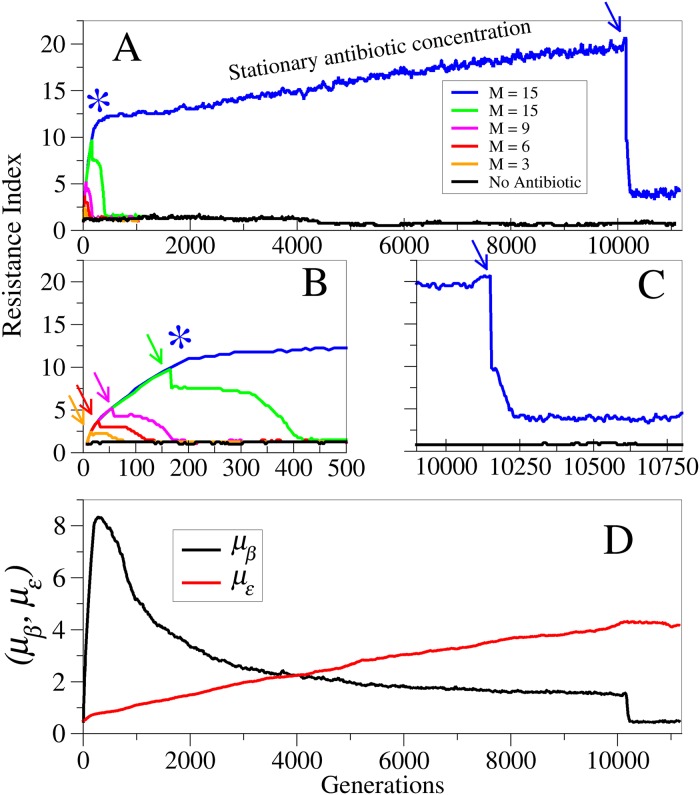
Fig 4. Genetic Assimilation occurs at longer time scales.
(A) Resistance Index (RI) as a function of time for populations induced with M antibiotic shocks. The different curves correspond to different values of M, except by the black one which corresponds to a control population growing with no antibiotic. (B) Blow up showing the first 500 generations. For each curve, the corresponding arrow indicates the time at which the antibiotic is removed. In the case of the blue curve, the asterisk indicates the time at which the last antibiotic shock is applied, after which the antibiotic concentration is kept constant. (C) Blow up of the last part of the simulation showing the point at which the antibiotic is removed from the population corresponding to the blue curve. It can be observed that in this case the final stationary value of the RI is about five times higher than that of the control population. (D) Evolution of the average transcription rate μβ and the average pump efficiency με for the population corresponding to the blue curve. Notice that as soon as the antibiotic concentration is kept constant, μβ starts decreasing whereas με keeps rising until the antibiotic is completely removed. This shows that the evolutionary process does not reach a stationary state (or fixed point) in the presence of antibiotic.

