Figure 13.

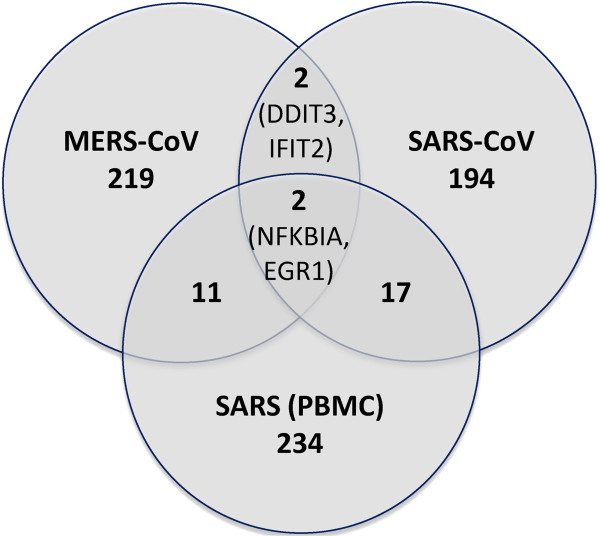
Venn diagram of the highly over and under expressed genes for the SARS-CoV infection in lung and PBMC cells and MERS-CoV infection in the lung cells vs. corresponding to their Mock.

Venn diagram of the highly over and under expressed genes for the SARS-CoV infection in lung and PBMC cells and MERS-CoV infection in the lung cells vs. corresponding to their Mock.