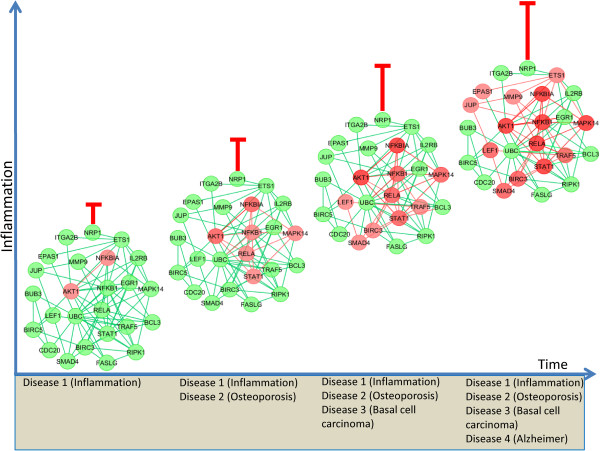
Figure 17.

Progressive temporal activation of pathways. A schematic view of networks becoming disease comorbidities increased for the perturbation of the pathways dysregulation advances with time. The red circles indicate increased levels of dysregulated gene expression relative to control and the red linked indicate dysregulated pathways that have been increased from infection as compared with normal control. The green indicated transcripts that are the same in control and infection condition. The four panels represent the network with time intervals of the infection progression. With time the inflammation confidence level is increased which is indicated by confidence interval.
