Figure 2.

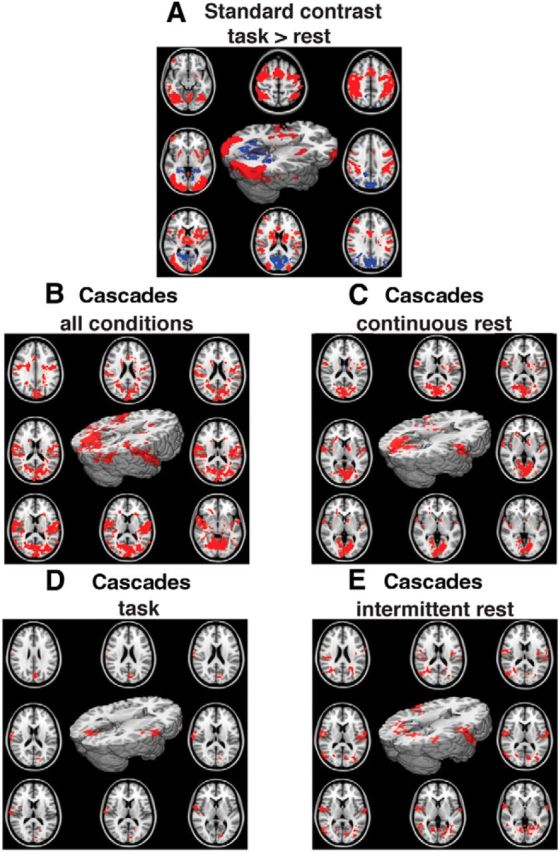
Spatial maps of fMRI activity. Cluster-corrected group-level statistics, with motion regressed from the data, projected onto the standard MNI 152 2 mm brain, as well as onto axial slices, for A–E. A, Standard contrast. CRT>rest: warm colors are voxels with relative activation, cold colors are voxels with relative deactivation. B, BOLD signal associated with EEG-defined cascades (using a threshold of 2 SD to define the EEG cascades). Results are combined across all three conditions: continuous rest, task, and intermittent rest. C, Same as B, but with only continuous rest data. D, Same as B but with CRT task data (significant effect of cascades is only apparent using the lower threshold, SD > 2; with higher thresholds no voxels survive multiple-comparison correction. E, Same as B, but with only intermittent rest data.
