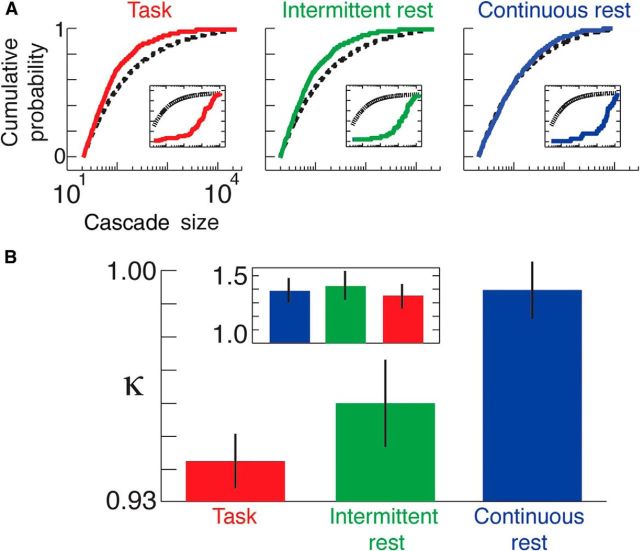
Figure 3.
κ across individuals and scanning conditions. A, Cascade cumulative probability size distributions for an individual subject across all three scanning conditions (continuous rest, task, and intermittent rest). Reference power laws are shown by black dotted lines. Results for temporally shuffled EEG data are shown in the insets. B, Average values of κ for each scanning condition across all individuals; results are shown using a threshold of 2 SD but similar results are found for a range of SD threshold values. The result for temporally shuffled EEG data is shown in the inset.

