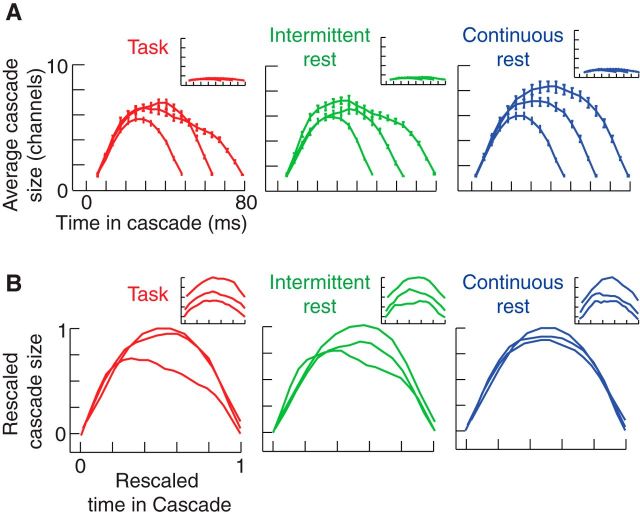
Figure 4.
Cascade shapes. A, Average sizes of cascades across all subjects (at a threshold of 2 SD) at every time point for three different temporal scales for continuous rest, task, and intermittent rest. Results for temporally shuffled EEG data are shown in the inset. B, Cascade-shape curves in A, rescaled across both the x- and y-axis as described in Materials and Methods. Results for temporally shuffled EEG data are shown in the inset.

