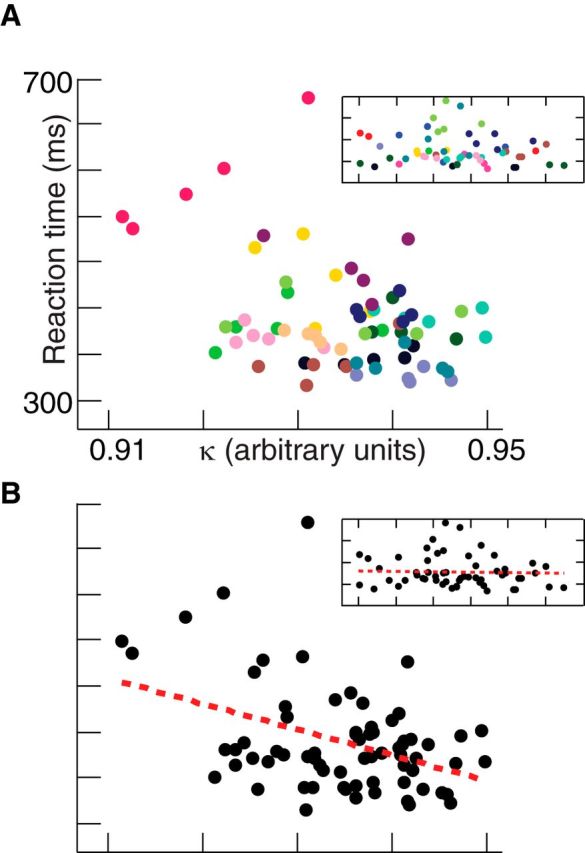
Figure 5.

κ versus reaction time. A, Reaction times of subjects, with one value for each subject and scanning block, plotted against the corresponding EEG-derived κ values, with each individual assigned a different color. The result for temporally shuffled EEG data is shown in the inset. B, Same as A, but with best-fit regression line and the result for temporally shuffled EEG data shown in the inset.
