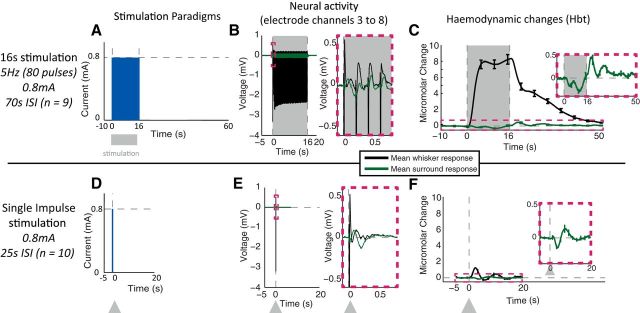
Figure 2.
Whisker stimulation paradigms. A, D, Temporal profile of pulse(s) of electrical stimuli presented to whisker pad. B, E, LFP neural responses, recorded in whisker barrel and surrounding regions, averaged across stimulation trials and across electrode channels 3–8 (equating to 250–750 μm below the cortical surface). C, F, Time series of changes in Hbt, generated from regions of interest overlying the activated whisker barrel cortex and surrounding regions, averaged across stimulation trials. Stimulation period represented with gray boxes and arrows. Error bars represent SEM across subjects. Responses averaged across subjects (n = 10 for single impulse and n = 9 for 16 s train stimulation paradigm).

