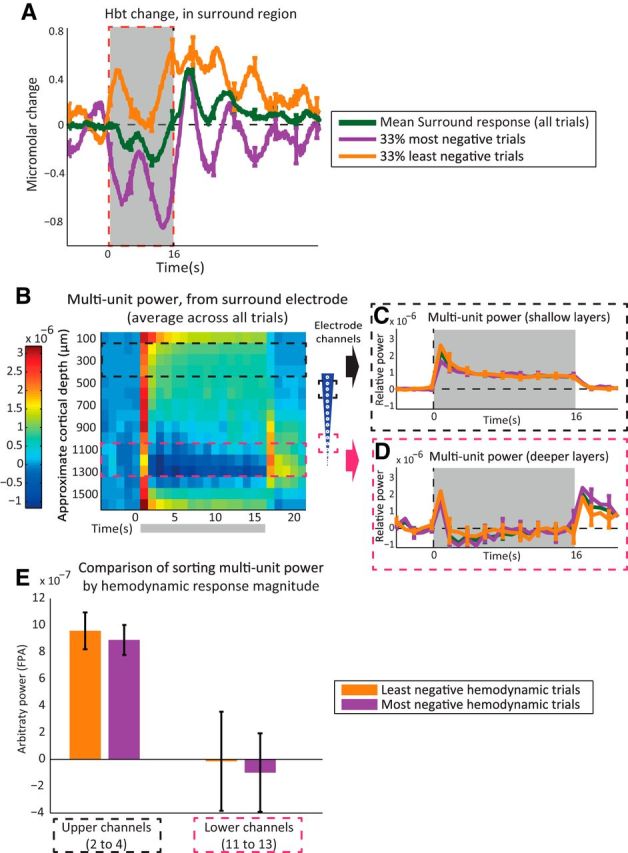
Figure 3.

Sorting of hemodynamic responses evoked by presentation of 16 s train (5 Hz) electrical stimulation to the whisker pad. A, Change in Hbt, generated from a region surrounding the activated whisker barrel cortex, having a negative hemodynamic response. Individual stimulation trial hemodynamic responses were sorted by area of response during stimulation (0–16 s). Green, Mean of all trials (100%). Purple, Most-negative trials (33%). Orange, Least-negative trials (33%). B, MUA (300–3000 Hz) frequency power analysis (1 s bins) of neural activity recorded from surround region electrode. C, Time series of MUA power from surround electrode, upper channels (2–4), with average response from all trials (green) and trials sorted by surround hemodynamic response area. D, MUA power from surround electrode lower channels (11–13). E, Averaged MUA power over period of stimulation (0–16 s), comparing trial sorting of neural responses by magnitude of surround region hemodynamic response, from upper and lower electrode channels. Stimulation period represented with gray boxes. Error bars represent SEM across subjects. Responses averaged across subjects (n = 10).
