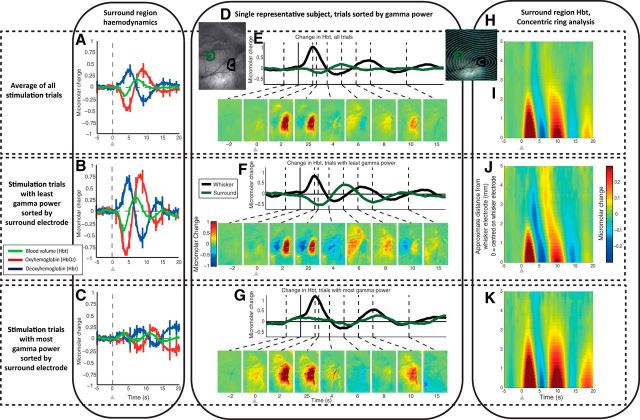
Figure 5.
Spatial–temporal representation of hemodynamic changes evoked by single-impulse stimulation, sorted by gamma power (30–80 Hz) from the upper cortical layers (channels 3–8) of the surround electrode (300–2000 ms after stimulus presentation). A, Hemodynamic response in surround region, evoked by single-impulse stimulation of the whisker pad, average of all trials. B, Hemodynamic response in surround region, average of trials (33%) having the least gamma power in the surround region, in the upper cortical layers (channels 3–8). C, Hemodynamic response in surround region, average of trials (33%) having the most gamma power in the surround region, in the upper cortical layers. D, In vivo grayscale image of thinned cranial window from a single representative subject, with regions of interest around the two recording electrodes used for time-series generation. E–G, Averaged Hbt changes, evoked by single-impulse stimulation from a single representative subject, all trials (100%), least gamma (33%) and most gamma (33%) respectively, and gamma power recorded from surround electrode. Hbt changes in the whisker region response (black) and surround region response (green). Montage of images shows spatial maps of micromolar changes in Hbt. Each is averaged over a second and represents a corresponding time point in the stimulation trial. Increases in Hbt are toward the red color range, with blue representing negative changes. H, In vivo grayscale camera image of thinned cranial window from a single representative subject, with a series of concentric rings centered on the whisker barrel electrode. These were used to select pixels for selection of data as a function of distance away from the electrode. I–K, Hbt changes, with data from all trials, least gamma power (33%) and most gamma power (33%) respectively. The y-axis represents distance away from the tip of the whisker electrode, with each row in the image generated from pixels within each concentric ring. Stimulation represented with arrows. Error bars represent SEM across subjects. Responses averaged across subjects (n = 10), except for single subject (D–H).

