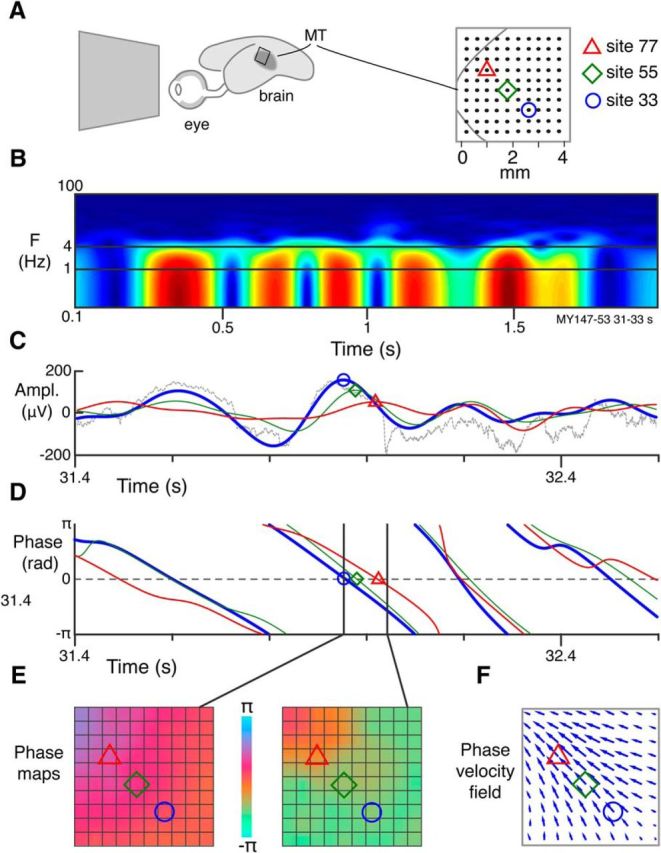
Figure 1.

Extraction of PVFs from LFP recordings. A, Representation of marmoset eye and brain showing approximate position of MT area and position of electrode array. Magnified view of electrode array at right shows estimated border of MT and electrode spacing. Three recording sites are indicated. B, Normalized time-power spectrum of LFP recorded from site 33 over 2 s. Warmer colors represent higher root-mean-squared power. C, Bandpass (1–4 Hz) filtered LFP amplitude recorded over 1 s from the three sites shown in A. Thin gray line indicates raw trace for site 33. D, Instantaneous phase of the filtered LFP for the three indicated sites. Symbol positions represent how discontinuities at ±π occur at minima in the LFP signal; zeros occur at maxima. Thin gray line indicates raw trace for site 33. E, Single-channel phase signals are combined to give 2D phase maps at each recorded time step. Phase maps are bilinearly interpolated over reference (n = 4) and inactive channels (n = 3). F, PVFs are calculated between consecutive phase maps. PVFs are typically calculated between maps separated by 1 ms; more temporally separated maps are presented here for display purposes.
