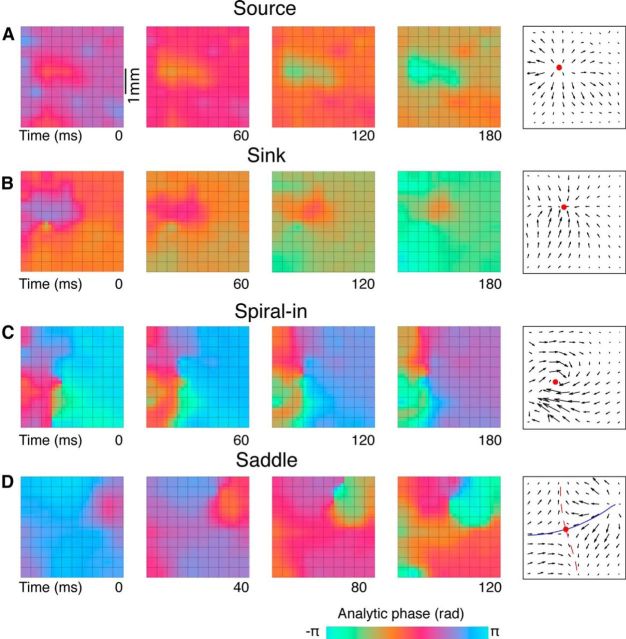
Figure 2.
Examples of complex waves. Color maps show successive frames of instantaneous phase maps. Quiver plots show PVFs at a single time step within the patterns. Filled circles represent critical points. A, Phase expands from a source point. B, Phase contracts toward a sink point. C, Phase rotates around a central singularity in a spiral wave. D, Phase moves toward a central point (from bottom-left and top-right) and away from the central point (to top-left and bottom-right) in a saddle pattern. These stable (blue, solid) and unstable (red, dashed) directions are shown as lines on the PVF.

