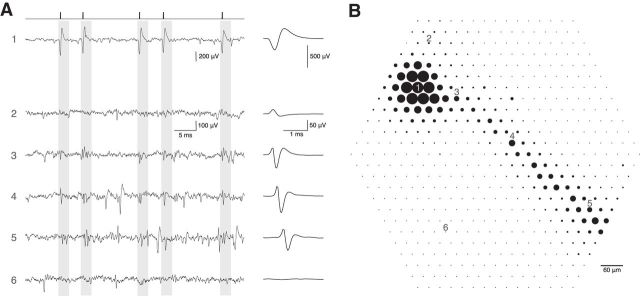
Figure 2.
Electrical image of retinal ganglion cell action potentials. A, Left, Raw voltage traces as a function of time recorded on six electrodes indicated in B. Times of easily identified spikes recorded from a single cell on Electrode 1 are identified as ticks at top. The average waveform of these five spikes and 2121 other similar spikes in the recording is shown at the right, expanded in time. Voltage traces for Electrodes 2–6 have the same time windows highlighted, corresponding to the time of the spike of the cell recorded on Electrode 1. Average waveforms on these electrodes, calculated on the same time windows, are shown at right. Distinct waveforms reveal characteristic average spike signatures for this cell on the different electrodes. Electrode 6 shows little or no voltage deflection associated with a spike in this cell. B, The maximum absolute amplitude of average voltage deflections from A are shown for each of the 519 electrodes in the hexagonal array, indicated by the diameter of the dot plotted at each electrode location. Large amplitudes near Electrode 1 are saturated. Apparent soma and dendrites are in cluster at top left, apparent axon extends down and right.

