Figure 4.

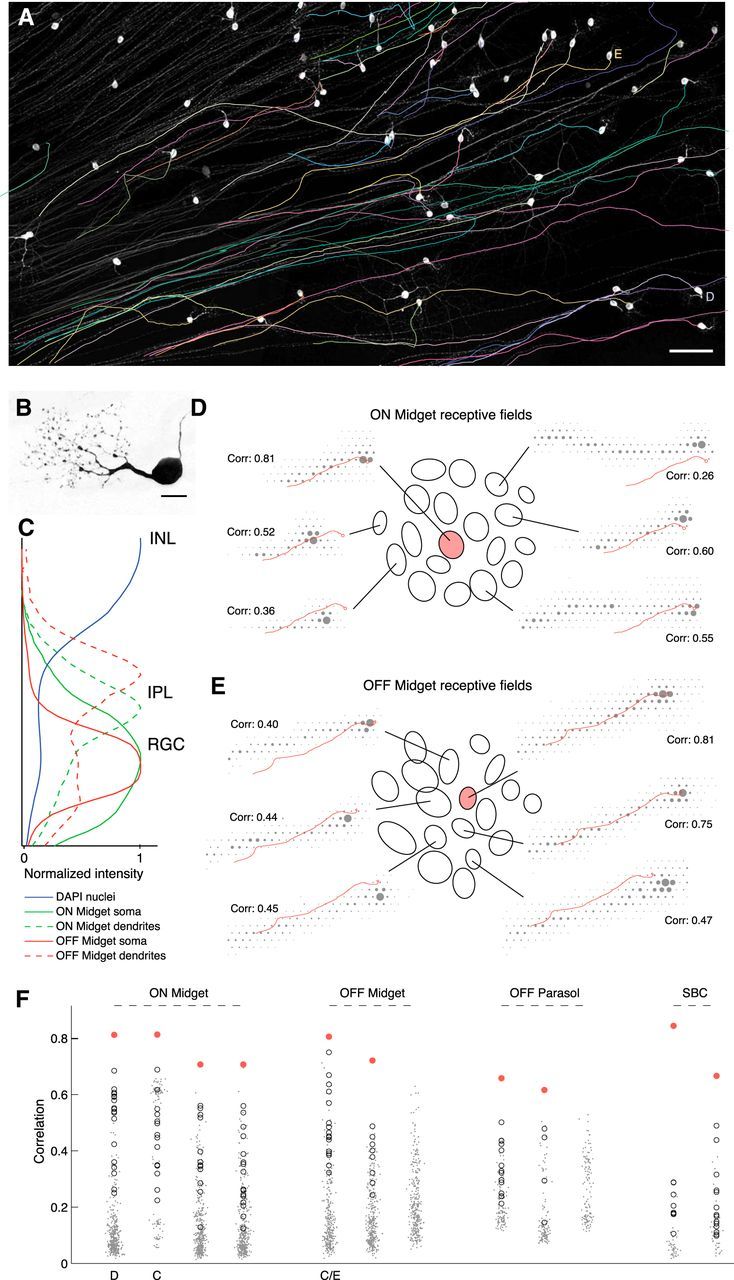
Matching axon trajectories. A, Traced axon trajectories (colored) are shown superimposed on grayscale image of GFP-labeled cells (see Materials and Methods). White somas and untraced axons are visible, traced axons obscured by traces. The cells used in D and E are labeled alongside. Scale bar, 100 μm. The imaged region corresponds closely to the borders of the rectangular recording array. B, Close-up image of a single labeled soma and dendrites with characteristic midget RGC morphology. Scale bar, 15 μm. This cell does not appear in other panels. C, Density of fluorescence over the normalized thickness of the inner nuclear layer (INL), inner plexiform layer (IPL), and RGC layer, within regions of interest local to two putative midget RGCs. DAPI signal is over the whole image and shows two peaks for nuclei dense regions at the centers of the RGC layer and INL. Density of somal GFP label peaks near the center of the RGC layer for both cells. Density of dendritic GFP label peaks in the proximal IPL for the putative ON midget, and in the distal IPL for the putative OFF midget, as expected for ON and OFF cell processes. D, Correspondence between a GFP-traced ON midget axon trajectory and selected recorded electrical images. Ellipses show Gaussian fits to the receptive fields of the putative matching RGC (shaded pink) and all surrounding RGCs of the same type (open) in the recording. For six of these RGCs, the electrical image is shown overlaid with the traced axon trajectory. Correlations indicated are between the recorded electrical image and the GFP-predicted electrical signal (see Materials and Methods). E, As in D, for an OFF midget axon tracing. F, Correlations for 12 axon tracings against full populations of recorded electrical images of the appropriate RGC type. In most cases, the best match (shaded pink) is clear relative to the rest of the population. The immediately surrounding RGCs, equivalent to the receptive field ellipses shown in C, D, are open circles. Remaining population are dots, with small random scatter on the x-axis to aid visualization. The cells used in C–E are labeled beneath. In two cases, there is no clear match among the recorded electrical images.
