
Figure 5.
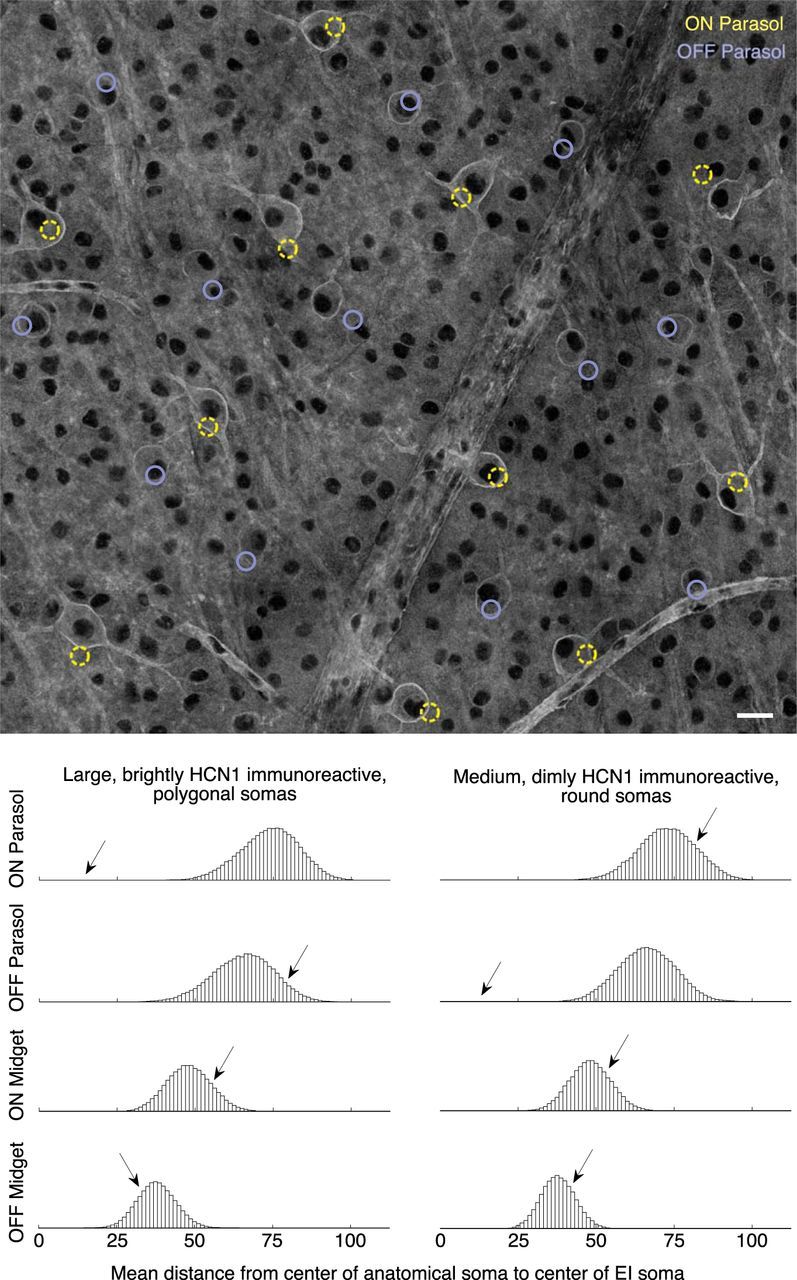
Matching molecularly identified subsets of cells. Top, Whole-mount HCN1 immunolabeled retina, at the level of the retinal ganglion cells. Black lacunae are cell nuclei, bright outlines are labeled cells. Rope-like structures are blood vessels (labeled by conjugated peanut lectin in the same channel). Colored circles represent the soma locations estimated from electrical images of ON and OFF parasol cells, with apparent correspondence to two distinct HCN1-labeled populations (see text). Scale bar, 25 μm. Bottom, Histograms showing results of permutation analysis (see Materials and Methods). Arrows indicate the location of the actual observed data; remaining data are from random permutations of electrical image-estimated locations. For most pairings, e.g., either HCN1-labeled population versus either population of midget electrical images, the actual data match no better than chance (arrows in the middle of permutation histograms). Two notable exceptions (arrows well outside permutation histograms) indicate probable matches.