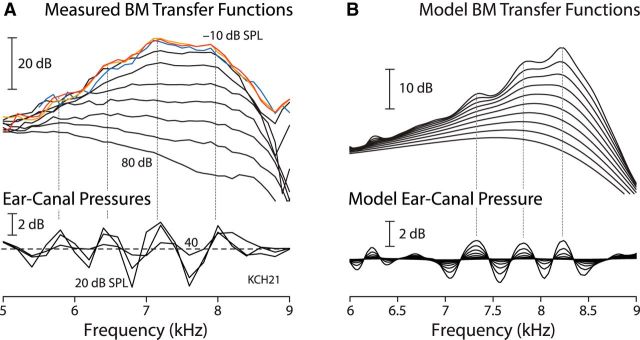
Figure 2.
Spectral ripples in BM transfer functions and ear-canal pressure. A, Isostimulus BM velocity transfer functions (top) and normalized ear-canal pressures (bottom) measured in a sensitive chinchilla. BM data were recorded from −10 to 80 dB SPL in 10 dB steps. For clarity, transfer functions in the linear regime where the curves overlap and the ripples are largest are shown in color [(−10, 0, 10) dB SPL ↔ (red, orange, blue), respectively]. Ear-canal pressures were measured at 20, 30, and/or 40 dB SPL probe levels and then normalized by the stimulus amplitude. Dotted vertical lines mark the approximate locations of the peaks in ear-canal pressure and show that the ripples in the BM transfer functions and ear-canal pressures are highly correlated. B, BM velocity and ear-canal pressure transfer functions computed using active cochlear models containing mechanical irregularities in the BM admittance. Intensity dependence was simulated using a family of linear models with the same pattern of irregularities but differing in overall amplifier gain. The model reproduces the observed equality of spacings between the BM and ear-canal ripple peaks. In the model, the two interference patterns can be shifted relative to one another slightly by modifying phase shifts associated with middle-ear transmission and reflection. Adapted from Shera and Cooper (2013).

