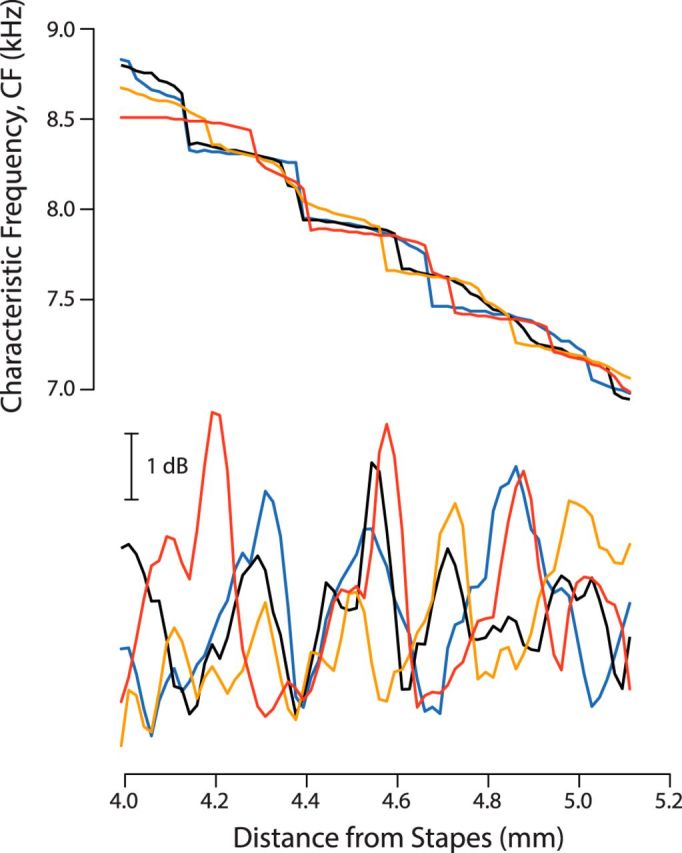
Figure 7.

Tonotopic and sensitivity microstructures in four different “ears.” The two panels show BM CF (top) and peak mechanical sensitivity (bottom) versus cochlear location computed in four models identical in every way except for the random pattern of micromechanical irregularities. Different ears are shown using different colors; the results from Figures 5 and 6 are included for comparison (blue lines).
