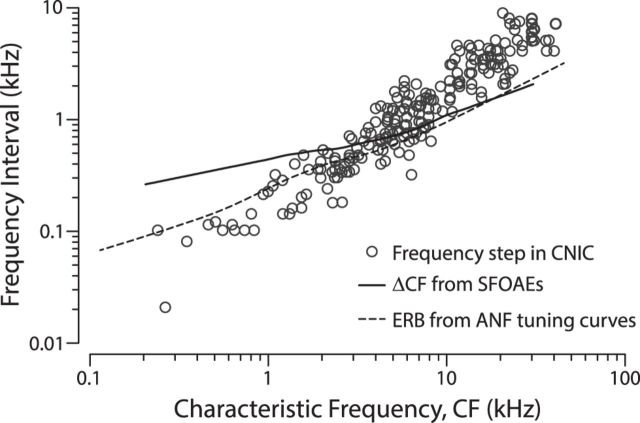
Figure 8.
Tiered tonotopy in the cat. Open circles (○) show frequency step heights versus CF obtained from high-resolution tonotopic maps of the CNIC (data from Schreiner and Langner, 1997, their Fig. 2c). The solid line gives the expected trend for the mode of the step heights for the cat cochlear map estimated using Equation 1 from measurements of SFOAE delay obtained at 40 dB SPL (Shera and Guinan, 2003). The dashed line shows a trend line fit to ERBs computed from neural tuning curves measured in cat auditory nerve fibers (Shera et al., 2010).

