
Figure 2.
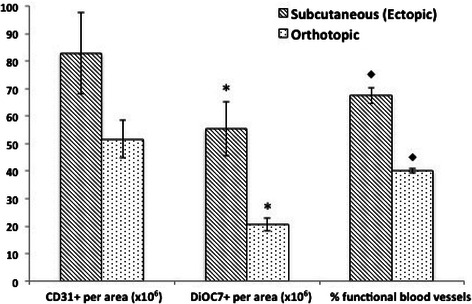
The number of total (CD31+) and functional (DiOC7+) blood vessels (per tumor area), and the percentage of functional blood vessels present in untreated MCF-7 subcutaneous or orthotopic xenografts. Bars represent the mean of 2-12 tumors; error bars represent standard error of the mean (SEM). Scale – numeric values represent number of blood vessels per unit area (x106) for the left and middle panels, and percent functional blood vessels for the right panel. Symbols represent statistical significance between subcutaneous and orthotopic tumors for functional (*) and percent functional (♦) blood vessels.