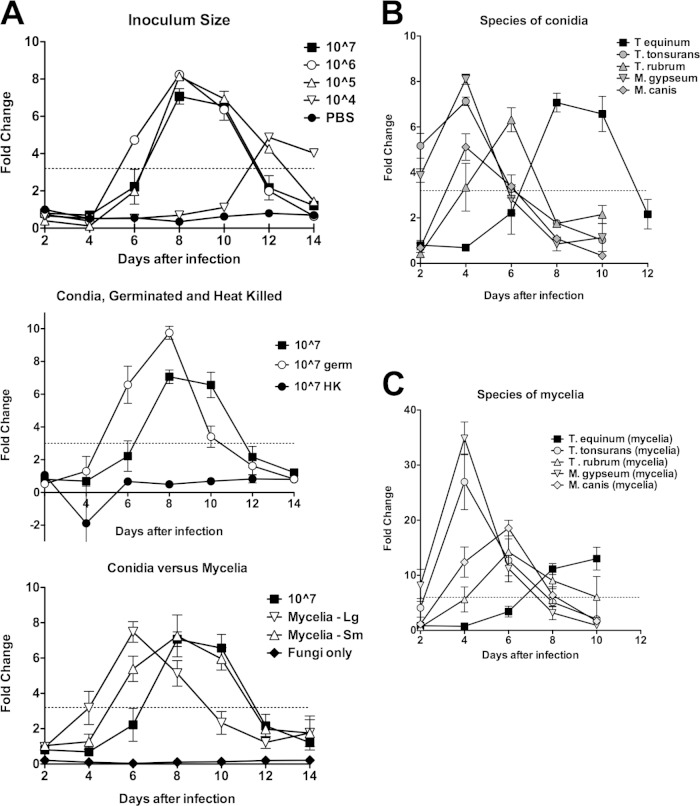
FIG 1.
Dermatophytes cause LDH release by EpiDerm tissues. (A) Pilot experiment in which EpiDerm tissues were exposed to dermatophyte cells and LDH release was measured. Data from all graphs were obtained simultaneously. Values are expressed as fold change equal to the value divided by the day 2 PBS control average. Error bars represent standard errors. Top, inoculum size. A pilot experiment in which increasing amounts of T. equinum conidia were incubated with EpiDerm tissues. Experiments using 107 conidia/tissue were performed in triplicate. Because of the limited number of EpiDerm samples in the experiment, the other levels of conidia were tested in a single biological sample. For 107, values above the dotted line (3.2-fold change) were all statistically different (P < 0.05) from the PBS control. Statistics could not be performed on the other conidial concentrations. The PBS controls for all 14 days are shown. While they are not statistically significant, the values trend upward, suggesting that LDH is being released in PBS alone. Middle, germinated and heat-killed conidia. Samples were from the same experiment as shown in the top graph. The line for 107 conidia is the same as that in the top graph, for comparison with germinated conidia and heat-killed conidia (see Materials and Methods). All samples were performed in biological triplicates. All values above the dotted line (3.2-fold change) are statistically significant (P < 0.05). Heat-killed conidia are not statistically different from PBS alone. Bottom graph, mycelial plugs. Large and small mycelial plugs (see Materials and Methods) were compared to the 107 conidia and to a control with fungi but without tissues. All samples were performed in biological triplicates. All values above the dotted line (3.2-fold change) are statistically significant (P < 0.05). The “fungi alone” data are statistically lower than PBS data at all time points, demonstrating that fungi do not produce LDH on their own. (B) Tissues were infected with 106 conidia from different dermatophyte species representing anthropophilic (T. rubrum, T. tonsurans), zoophilic (T. equinum, M. canis), or geophilic (M. gypseum) infections. Data points represent the average fold change from three biological triplicates, divided by the day 2 PBS control average. Error bars represent standard errors. Values above the dotted line (3.2-fold change) were all statistically different (P < 0.05) from the PBS control (except T. rubrum at day 4). Values below the dotted line were not statistically different (P < 0.05) from the PBS control (except at day 8 for T. tonsurans and T. rubrum). (C) Tissues were infected with mycelium plugs from the same species as in panel B. Mycelium plugs were obtained by using the thin end of a Pasteur pipette to transfer a fungal plug from a YEPD plate, and infections were performed in triplicate. LDH was detected in spent medium. Data points represent the average fold change from three biological triplicates, divided by the day 2 PBS control average. Error bars represent standard errors. Values above the dotted line (6-fold change) were all statistically different (P < 0.05) from the PBS control (except M. gypseum at day 2). Values below the dotted line were not statistically different (P < 0.05) from the PBS control (except at days 8 and 10 for T. tonsurans).

