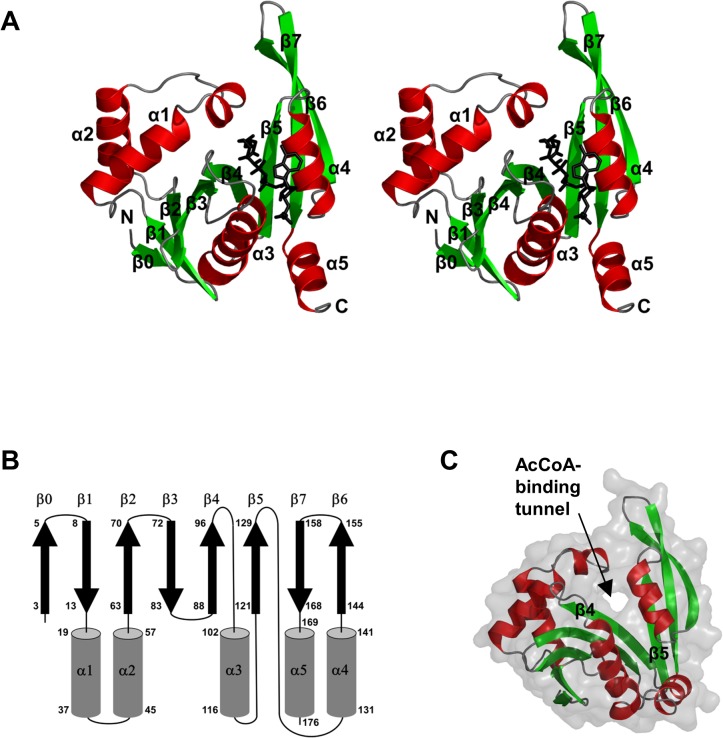
Fig 2. The overall fold of H. pylori PseH.
(A) Stereo diagram of the structure of the PseH monomer. β-strands and α-helices are represented as arrows and coils and each element of the secondary structure is labeled and numbered as in text. The bound AcCoA molecule is shown in black. (B) The topology of secondary structure elements PseH. The α-helices are represented by rods and β-strands by arrows. Residue numbers are indicated at the start and end of each secondary structure element. (C) The molecular surface representation of PseH showing the AcCoA-binding tunnel between strands β4 and β5, which is a signature of the GNAT fold.

