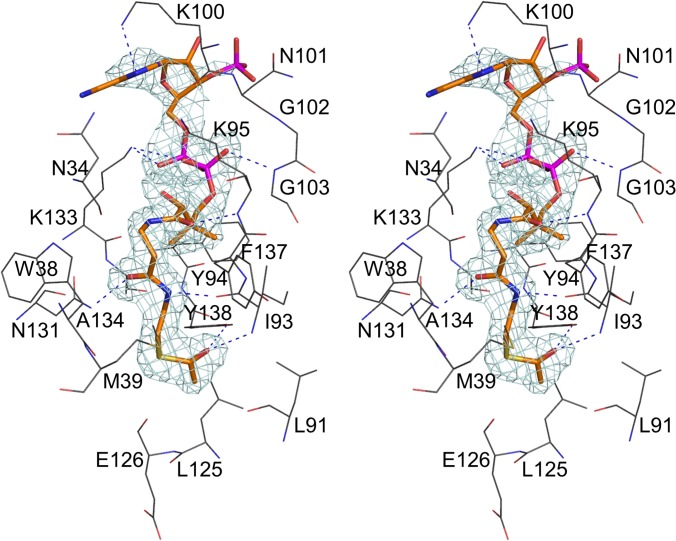
Fig 4. The stereoview of the electron density for AcCoA bound in the active site of PseH.
The cofactor molecule is shown in CPK representation and coloured according to atom type, with carbon atoms in orange, nitrogen in blue, oxygen in red, phosphorus in magenta and sulphur in yellow. Only the protein residues that form hydrogen bonds or van der Waals contacts with the cofactor molecule are shown for clarity. Protein carbon atoms are coloured black. The hydrogen bonds important for recognition of the cofactor are shown. The map was calculated at 2.3 Å resolution with coefficients |Fobs| − |Fcalc| and phases from the final refined model with the coordinates of AcCoA deleted prior to one round of refinement. The map is contoured at 3.0-σ level.

