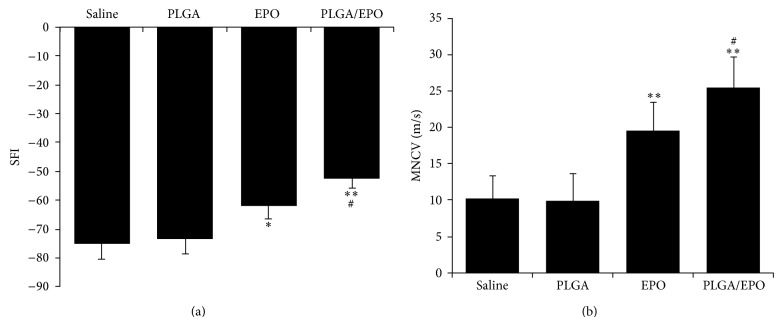
Figure 2.
Functional and electrophysiological evaluations 8 weeks postoperatively. (a) Comparison of the mean functional recovery of each group in terms of SFI derived from walking track prints. (b) Effect of different treatments on MNCV. Data are the mean ± SD. * P < 0.05 and ** P < 0.01 when compared with saline or PLGA group and # P < 0.05 when compared with EPO group.

