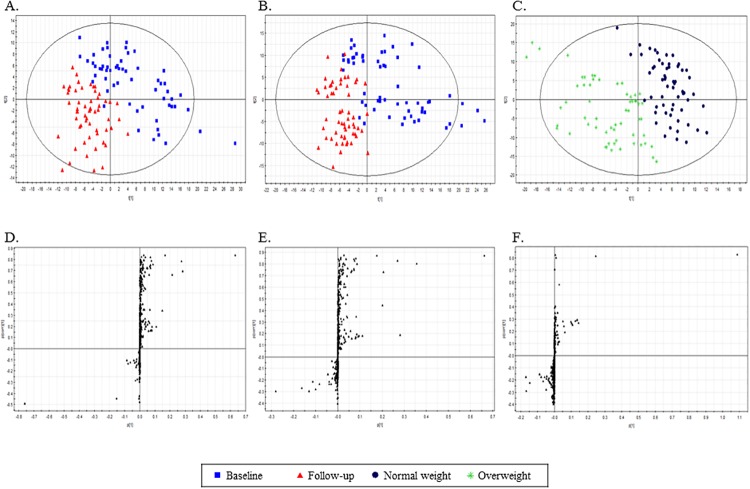
Fig 1. Identification of plasma metabolites that were significantly altered at the 3-year follow up.
A: Score plots from PLS-DA models for normal weight subjects (n = 59) at baseline and at 3-year follow-up. B: Score plots from PLS-DA models for overweight subjects (n = 59) at baseline and at 3-year follow-up. C: Score plots from PLS-DA models for normal weight and overweight subjects at 3-year follow-up. D, E, F: S-plots for covariance [p] and reliability correlation [p(corr)] from PLS-DA models.

