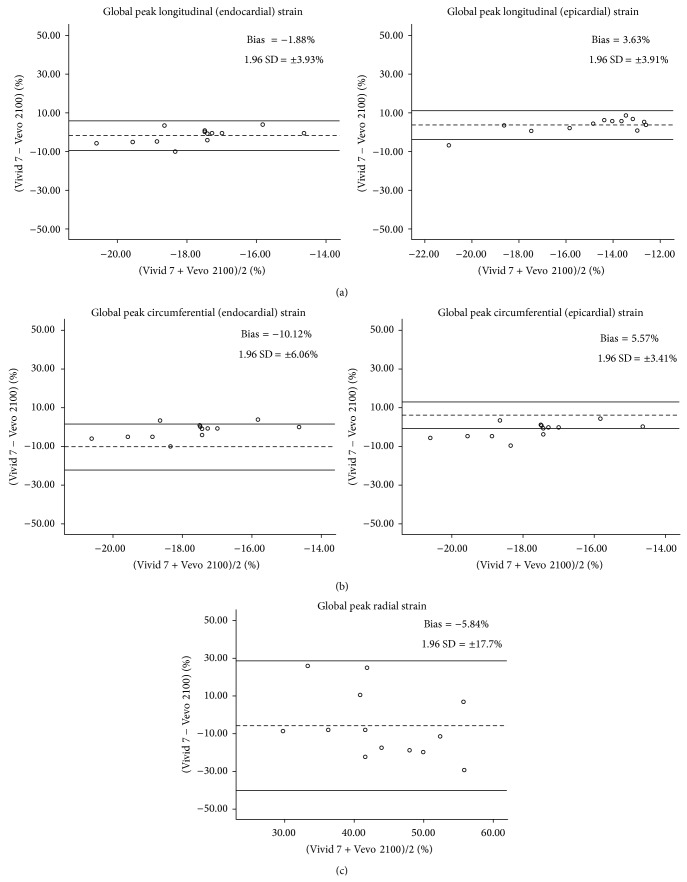
Figure 3.
Bland Altman plot depicts the agreement of strain analysis between EchoPAC (Vivid 7) and VevoStrain (Vevo 2100). (a) Global peak longitudinal strain between midmyocardium/endocardium and midmyocardium/epicardium shows narrower variation than (b) global peak circumferential strain and (c) global peak radial strain. Dotted horizontal lines denote bias (mean difference between two systems) and solid horizontal lines illustrate the 95% limits of agreement.

