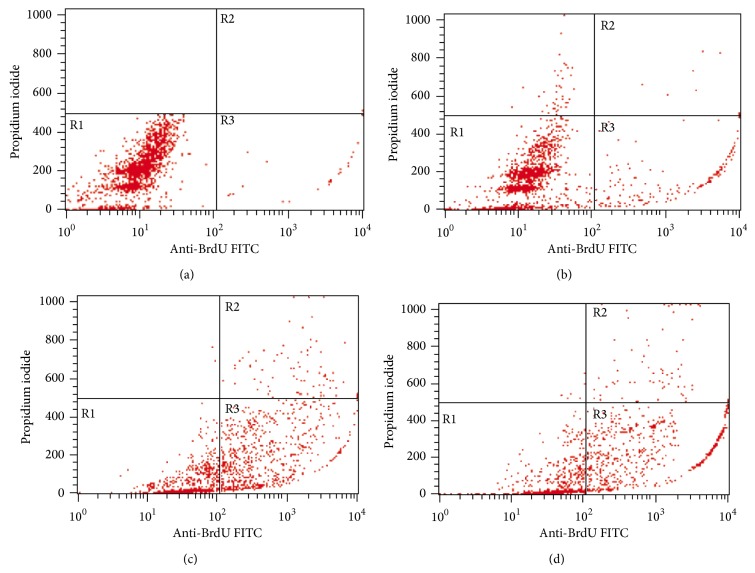
Figure 7.
Contour diagram of BrdUTP/PI flow cytometry for MDA-MB-231 breast cancer cell lines treated with NDV AF2240 IC50 concentration value. (a) Untreated cells after (b) 24 hours (c) 48 hours, and (d) 72 hours of treatment. The lower left quadrants of each panel (R1) show the viable cells, which exclude PI and are negative for BrdUTP binding. The upper right quadrants (R2) contain the nonviable, necrotic cells, positive for BrdUTP binding and for PI uptake. The lower right quadrants (R3) represent the fragmented DNA (apoptotic cells), BrdUTP positive, and PI negative.

