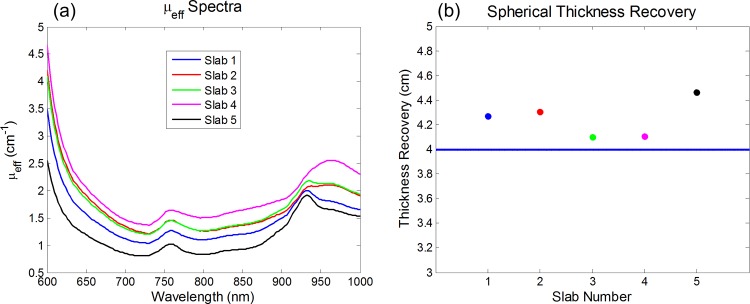
Fig 3. Computed μeff spectra and spherical geometry thickness recovery data.
(a) Five computed μeff spectra for different chromophore concentrations that span the range in breast tissue from the literature (each slab’s chromophore concentrations are listed below). The μeff variability is minimal around 925 nm. (b) Thickness recovered for the 4 cm chord distance in a spherical medium with the same chromophore concentrations as in Slab 1. The reference transmittance, T 0(λ*), for the application of Eq. (8) is taken to be the one for a 5 cm thick infinite slab with the chromophore concentrations of Slabs 1–5, as indicated in the x axis. Chromophore concentrations of each slab are listed as ([HbO], [Hb], [water], [lipid]): Slab 1 (14uM, 7uM, 20%, 65%); Slab 2 (17uM, 11uM, 30%, 45%); Slab 3 (18uM, 10uM, 30%, 60%); Slab 4 (28uM, 12uM, 45%, 30%); Slab 5 (6uM, 4uM, 20%, 75%).

