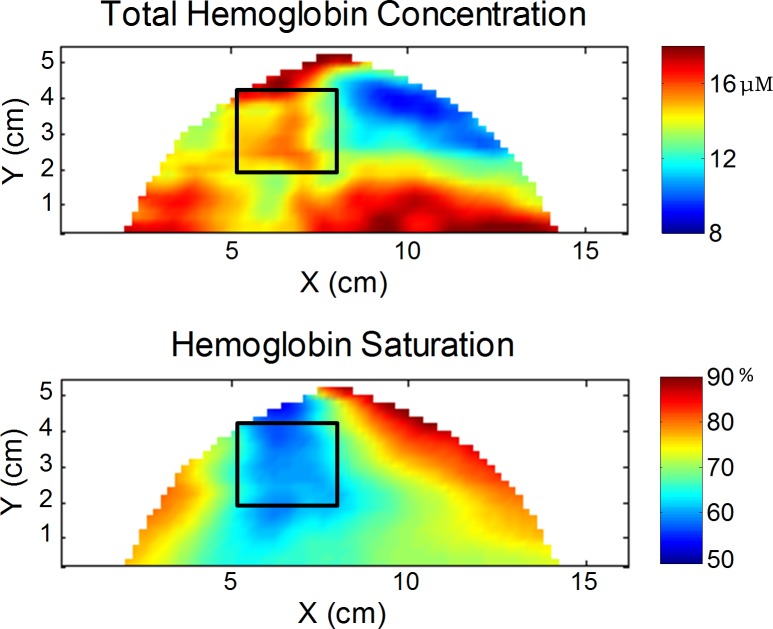
Fig 8. Optical maps of [HbT] and SO2 for a 59 year old patient with invasive ductal carcinoma in her left breast.
The black box indicates the tumor region identified based off of findings from the x-ray mammogram. The total hemoglobin concentration maps show a local increase in the region on the tumor, yet other areas of the breast also have increased [HbT]. The saturation maps portray that only in the tumor region is there a decrease in SO2.

