
Figure 1.
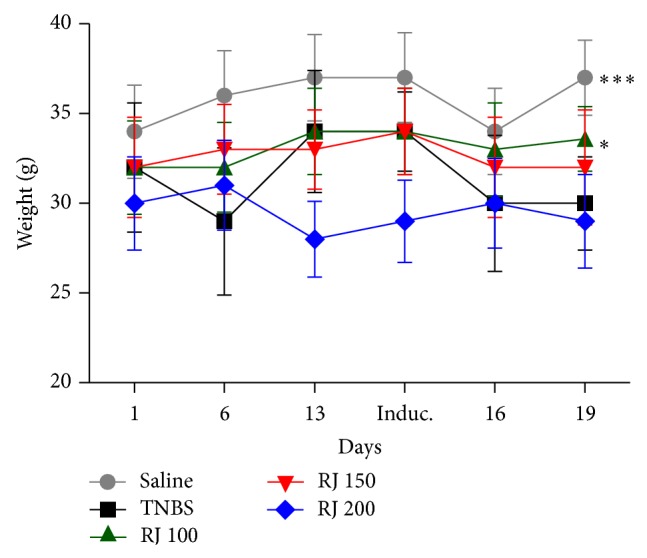
Weight means of the 5 different groups on days 1, 6, and 13 (before induction) and 16 and 19 (after induction). Data is presented as mean ± SEM. Two-way ANOVA followed by Bonferroni's t-test. * P < 0.05, *** P < 0.001 are significantly different from TNBS group.