
Figure 4.
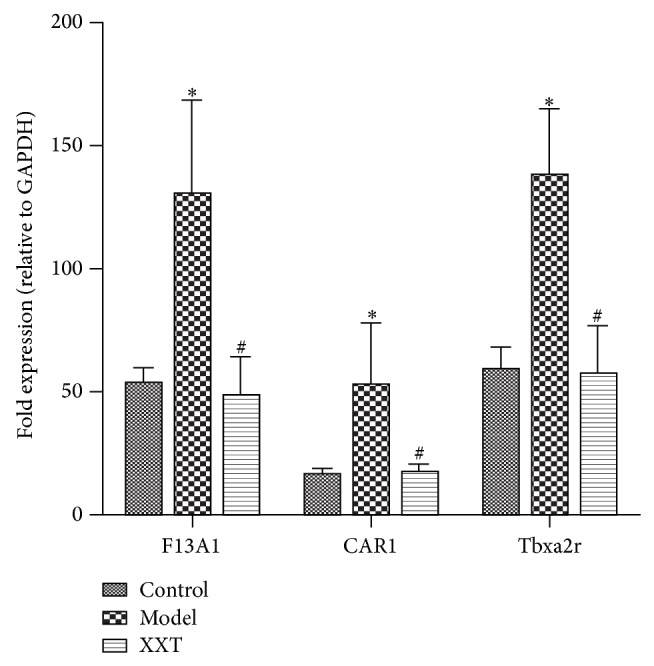
The mRNA expressions of F13a1, Car1, and Tbxa2r. * P < 0.01, the blood stasis model group versus NC group; # P < 0.01, the XXT group versus the blood stasis model group.
Official websites use .gov
A
.gov website belongs to an official
government organization in the United States.
Secure .gov websites use HTTPS
A lock (
) or https:// means you've safely
connected to the .gov website. Share sensitive
information only on official, secure websites.
The mRNA expressions of F13a1, Car1, and Tbxa2r. * P < 0.01, the blood stasis model group versus NC group; # P < 0.01, the XXT group versus the blood stasis model group.