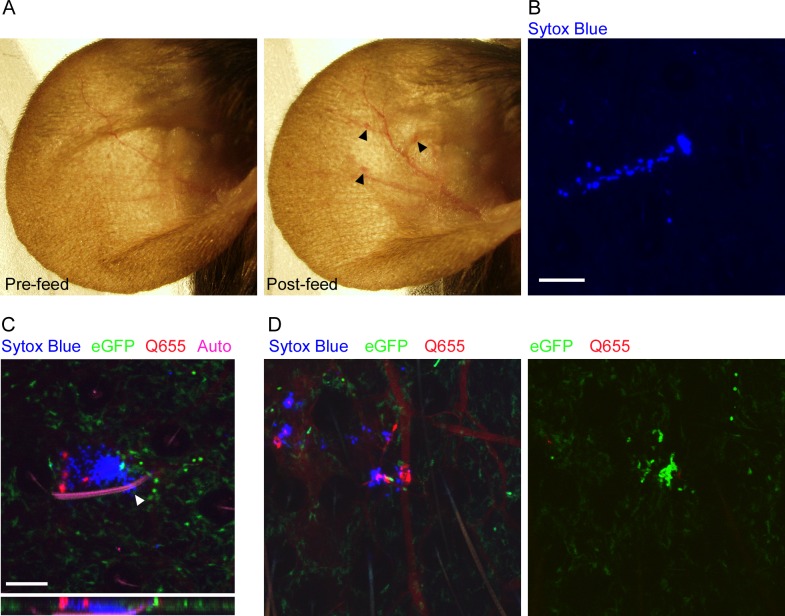
Fig 1. Characterization of flea bites in mouse skin.
(A), dissecting microscope images of a mouse ear before and after being fed upon by 3 blocked fleas for 50 min. Arrowheads indicate small spots of erythema. (B), Confocal image of the ear of a mouse injected i.p. with Sytox Blue prior to being fed upon by an uninfected flea. The blue color indicates an area where cells have been damaged by flea feeding. (C) Confocal image of the ear of a LysM-eGFP mouse that was injected with Sytox Blue i.p. and Qtracker655 vascular dye i.v. prior to being fed upon by a blocked flea. During feeding the flea was anesthetized with isoflurane and its embedded mouthparts cut with microscissors. GFPdim cells are macrophages, GFPbright cells are neutrophils, red is the Q655 vascular dye, blue is the Sytox Blue, and magenta is autofluorescence of the flea mouthparts. The arrowhead indicates where the flea mouthparts pierce the skin. The lower panel is an x-z cross-section through the bite site. (D), Confocal images of a mouse ear prepared exactly as in (C) after being fed upon by 2 uninfected fleas. The 0 h and 4 h time points are shown. The full time series can be seen in S1 Video. Scale bars represent 100 μm.

