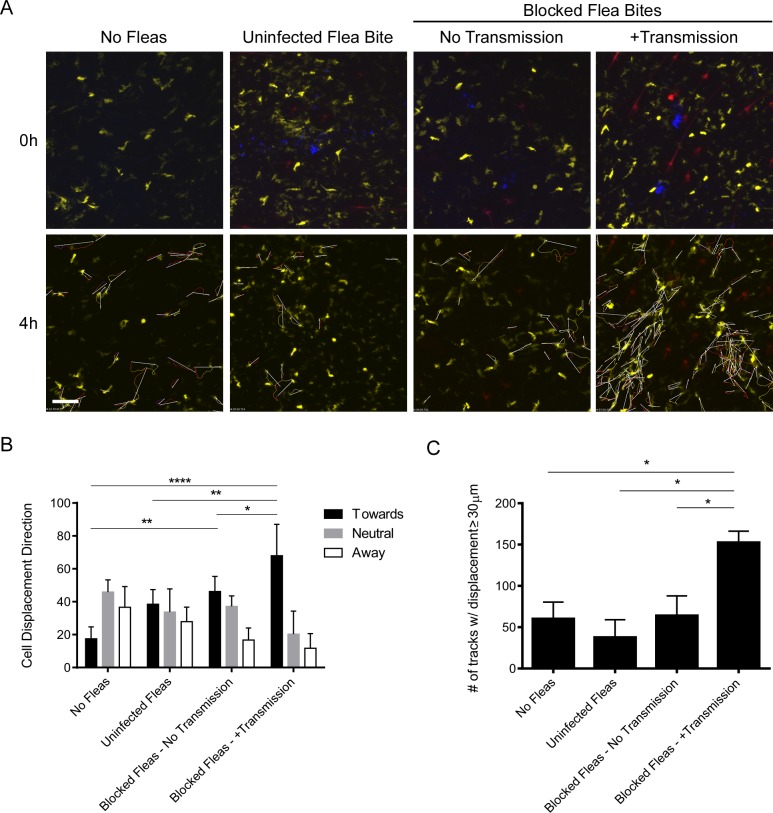
Fig 6. Imaging and tracking dendritic cell movement in response to flea bites and flea-transmitted Y. pestis in vivo.
CD11c-YFP mouse ears were fed upon by 1 uninfected flea for 10 min, Y. pestis pMcherry blocked fleas for 50 min (No Transmission = 5 fleas, +Transmission = 6 fleas), or no fleas (empty feeding chamber) for 10 min and imaged by confocal microscopy for 4 h. (A) Flea bite sites were identified by Sytox Blue staining (blue, upper panels only). Upper panels show t = 0 h and lower panels show t = 4 h. The full time series can be seen in S9–S12 Videos. Movement of YFP+ over the course of the experiment was tracked using the image-processing software Imaris. The lower panels also show the cell tracking data and displacement (arrows) for all displacement events ≥ 30 μm. YFP+ cells are dendritic cells (yellow), the red channel shows Y. pestis pMcherry, if present. All examples shown are representative of at least 3 independent experiments. Scale bar represents 100 μm. (B) The direction and length of net displacement were calculated and analysis was limited to displacement events ≥ 30 μm. The direction of cell displacement was manually scored as being “toward,” “neutral,” or “away” from the flea bite site (determined by the presence of bacteria and/or Sytox Blue staining). For the No Fleas condition, a spot at the center of the image field was arbitrarily chosen as the reference point for the scoring. The results shown are the mean of at 3 or 4 independent experiments. Error bars represent standard deviation. (C), The average numbers of displacement events ≥ 30 μm in length for each experimental condition were calculated. Error bars represent SEM. The results shown are a mean of 3 or 4 independent experiments. * = p≤0.05, ** = p≤0.01, and **** = p≤0.0001.

