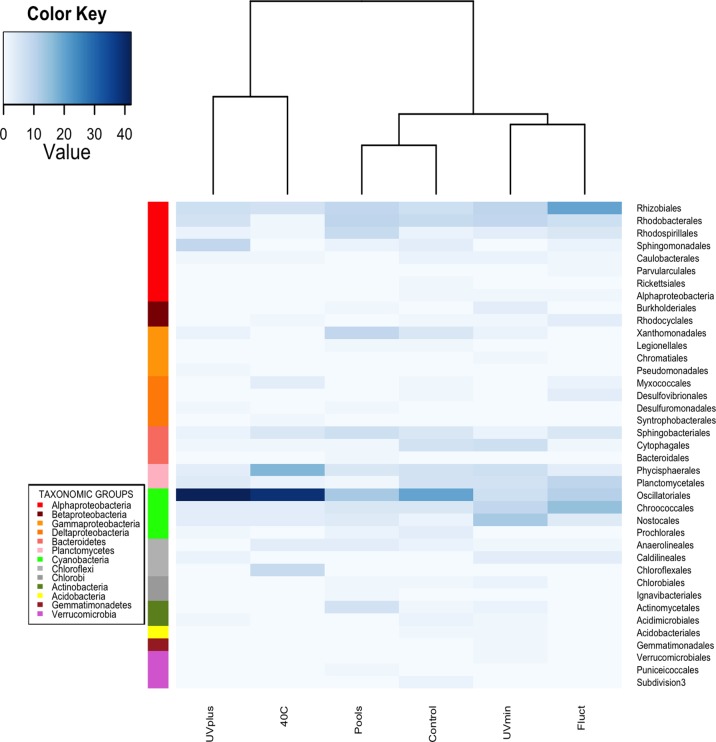
Fig 3. Heatmap showing the abundance of the 39 bacterial orders in the pools and treatments at the end of the experiment based on the 16S rRNA gene libraries.
The Bray-Curtis dissimilarity matrix and Ward’s hierarchical clustering algorithm were applied in this analysis. Higher abundance is indicated by increased blue color intensity. The value shown in the color key scale represents the number of sequences detected for each environment. Rows indicate bacterial orders and columns indicate the different environments.

