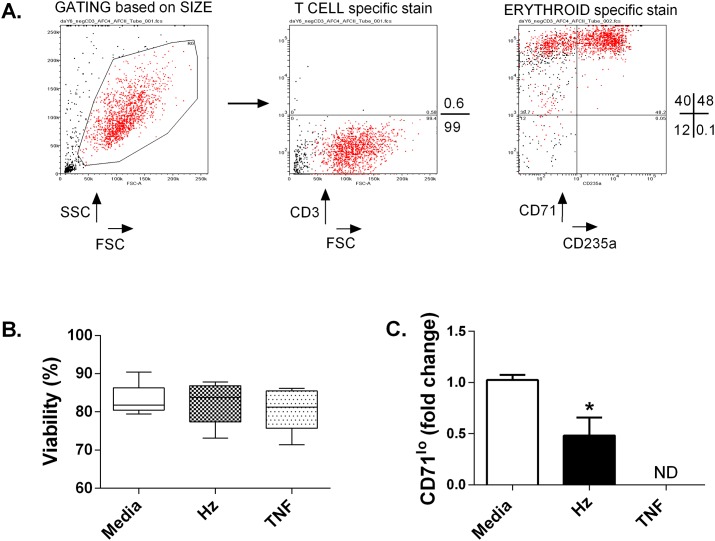
Fig 1. Representative example of samples used for microarray and rtPCR.
The purity of erythroblast populations treated with either TNF-α or hemozoin was determined by flow cytometry (A). The forward scatter (FSC) and side scatter (SSC) of live cells is shown in red. The proportion of cells (% of total events acquired) expressing lymphoid (CD3) and erythroid markers (CD71-CD235a+ and CD71+CD235a+) is represented by values to the right of each plot. The average response to treatment of all samples after 24 hours in which viability was assessed (B) or after 6 days when maturation was assessed by comparing the proportion of committed erythroid progenitors (CD235a+) that express low levels of CD71 (CD71lo) (C). Error bars show standard error of the mean of responses from 4 different donors; ND, not determined due to insufficient cell recovery. *p≤0.05 when compared with media alone (two tailed student’s test).

