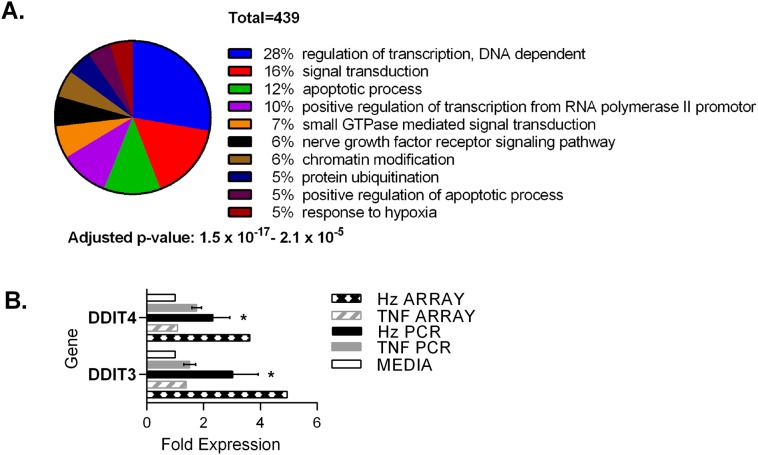
Fig 4. Up-regulated genes induced by hemozoin.
Pie chart showing the number of up-regulated genes associated with biological processes following treatment with hemozoin (A). Confirmation of observations in microarray data by rtPCR using TaqMan gene expression assays (B). Fold expression compared with cells cultured in media alone is shown. TNF, TNF-α; Hz, hemozoin. Statistical analysis of rtPCR data was performed using the two tailed student’s t test. * p≤0.05 when compared with media alone. Fold expression determined from the original array data is shown for comparison.

