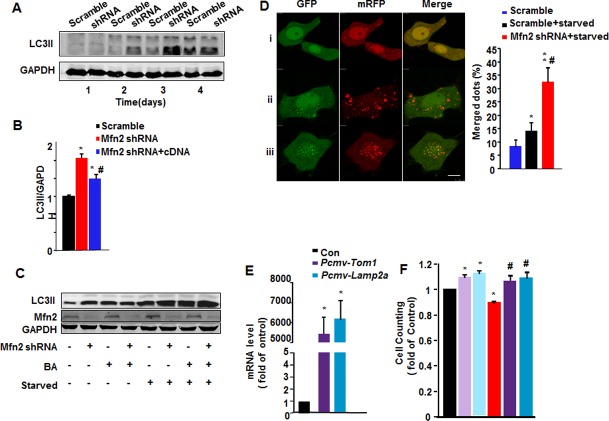
Fig 2. Mfn2 knockdown impairs autophagic degradation.
(A) Increased LC3-II level in Mfn2 knockdown HeLa cells by Western blot. n = 4 independent experiments for each group. (B) LC3-II:GAPDH ratios in HeLa cells infected with scrambled RNA, Mfn2 shRNA, or Mfn2 shRNA with Mfn2 cDNA. n = 3 independent experiments for each group. *, p<0.05 versus scramble control; #, p<0.05 versus Mfn2 shRNA group. (C) Western blot showing LC3-II levels in scramble and Mfn2 shRNA cells with or without starvation treatment in the presence or absence of lysosomal inhibitor Bafilomycin A1 (BA). (D) Confocal images of HeLa cells transfected with GFP-mRFP-LC3 plasmid, and co-infected with adenovirus containing scrambled RNA or Mfn2 shRNA, with or without starvation for 36 hours (left), and percentages of merged green and red LC3 dots to total LC3 dots. Scale bar: 10 μm. n = 20 cells for each group from 3 independent experiments. *, p<0.05 & **, p<0.01 versus scramble control; #, p<0.05 versus scramble starvation group. (E) mRNA level of Tom1 and Lamp2a by real-time PCR in HeLa cells transfected with Pcmv-Tom1 or Pcmv-Lamp2a plasmids. n = 3 independent experiments. (F) Fold changes of cell counting by CCK8 in HeLa cells infected with adenovirus containing scrambled RNA co-transfected with Pcmv vector or Pcmv-Tom1, Pcmv-Lamp2a, and Mfn2 shRNA, Mfn2 shRNA co-transfected with Pcmv-Tom1 or Pcmv-Lamp2a. n = 3 independent experiments. *, p<0.05 versus control; #, p<0.05 versus Mfn2 shRNA only group.

