
Fig 4. Inhibited glycolysis by Mfn2 knockdown.
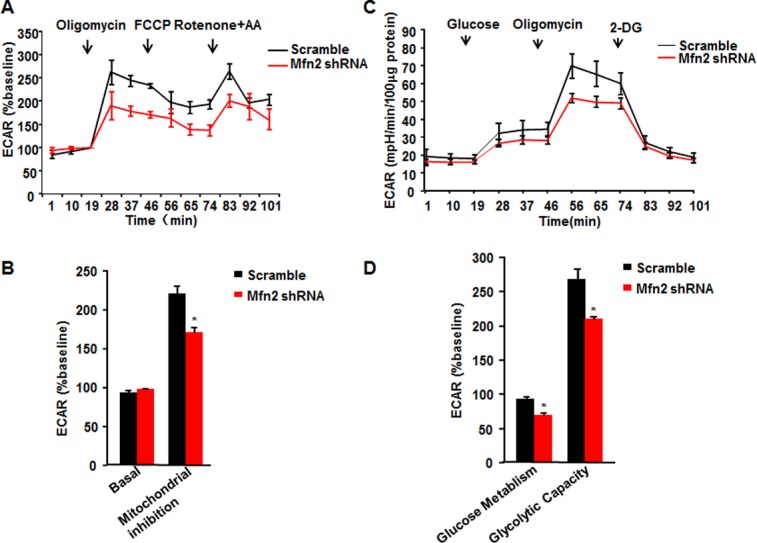
(A) Traces of extracellular acidification rates (ECAR) of HeLa cells in response to mitochondrial inhibitors. (B) Average data of basal ECAR and that in the presence of mitochondrial inhibitors as in A. (C) ECAR of HeLa in response to glucose, oligomycin, and 2-deoxy-D-glucose (2-DG). (D) ECAR showing glucose metabolism and glycolytic capacity. n = 3 independent experiments for each group. *, p<0.05 versus scramble control.