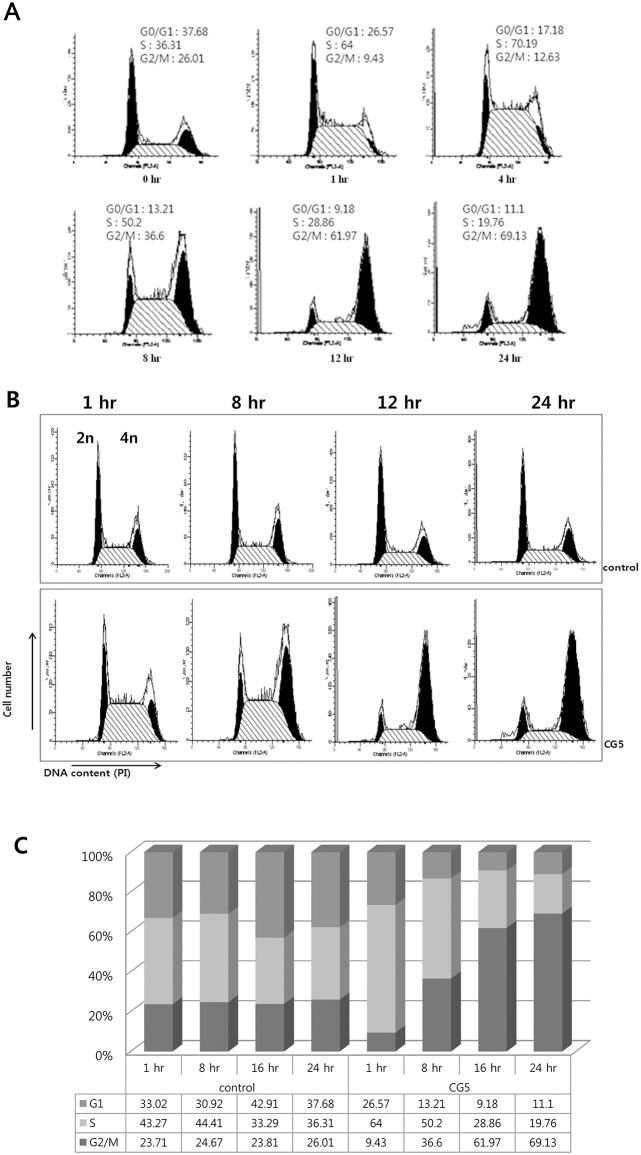
Fig 2. Flow cytometric investigations of CG200745-treated Calu6 cells.
Calu6 cells treated with 3 μM of CG200745 were analyzed cell cycles on flow cytometer. Each histogram consists of two black peaks and one scratched region indicating G0/G1 phase, G2/M phase, and S phase, respectively. The effect of CG200745 on the cell cycle distribution was analyzed at for various time points (A), or compared to untreated cells (B) depicting as a graphical view (C).

