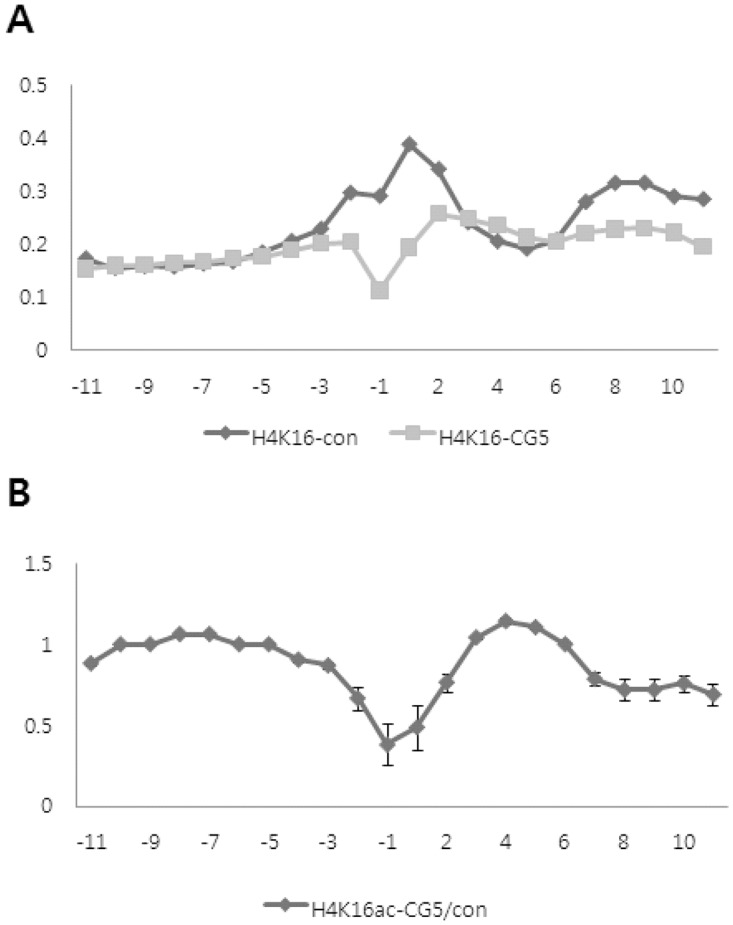
Fig 4. H4K16 acetylation status adjacent to transcription start site (TSS).

H4K16 acetylation adjacent to the TSS was assessed by calculating the average ChIP/input log ratio at the same distance from the TSS. The numbers in the X axis indicate the distance from TSS. Y axis represents the average ChIP/input log ratio. (A) H4K16 acetylation status of genes around TSS was individually depicted in CG200745-treated or untreated Calu6 cells. (B) The level of H4K16 acetylation was compared between CG200745-treated and untreated cells according to the distance from the TSS. Two separate experiments were performed to calculate the error bar for each position.
