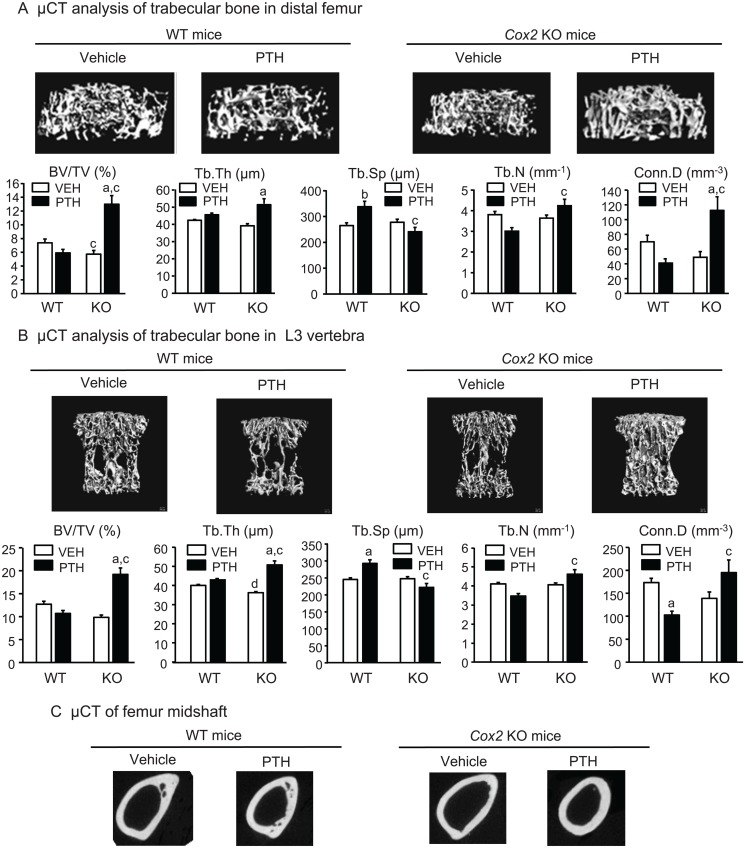
Fig 2. Morphometry of femoral bone and L3 vertebral bone in mice infused for 12 days.
A. Representative μCT longitudinal images (top panel) and morphometric analyses (bottom panel) of trabecular bone in the metaphyseal region of distal femur. Bars are means ± SEM for 7 WT and 7 KO mice treated with vehicle and 8 WT and 8 KO mice treated with PTH. B. Representative μCT cross-sectional images (top panel) and morphometric analyses (bottom panel) of trabecular bone in the L3 vertebrae. Bars are means ± SEM for 7 WT and 7 KO mice treated with vehicle and 8 WT and 8 KO mice treated with PTH. C. Representative μCT cross-sectional images of midshaft of femurs. aSignificant effect of PTH, p<0.01; bp<0.05. cSignificant effect of genotype, p<0.01; dp<0.05.

