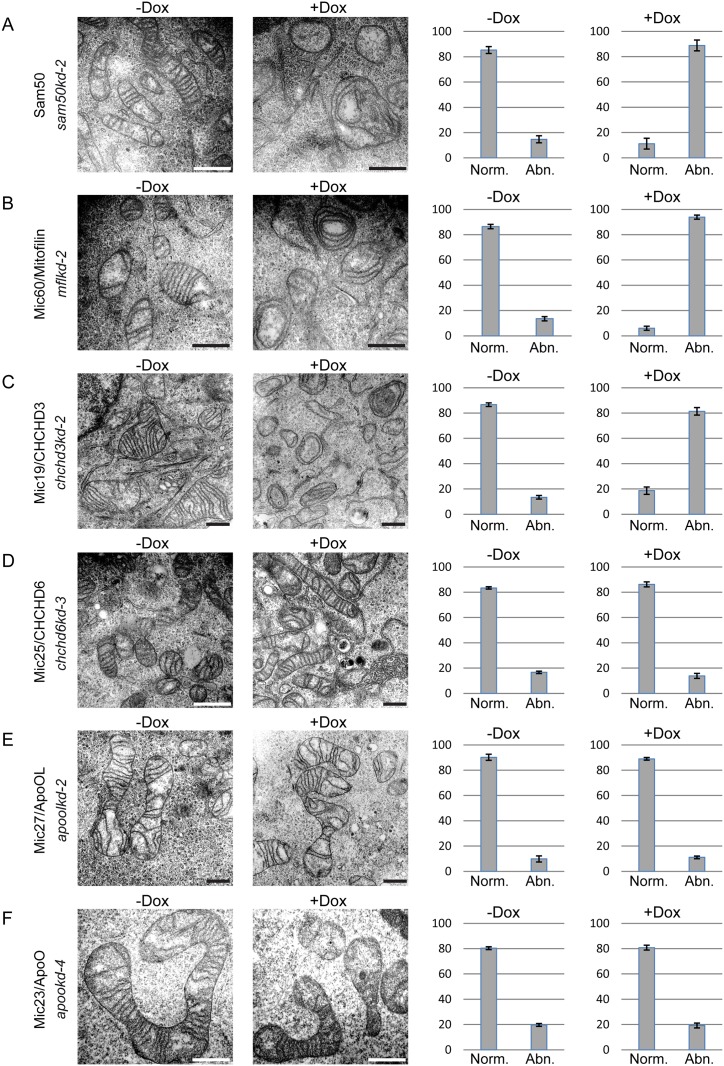
Fig 4. Transmission electron microscopy of MIB and MICOS components knockdown cell lines.
(A-F) Inducible knockdown cells as described in Fig. 2, carrying shRNA that downregulates Sam50 (A, sam50kd-2), Mic60/Mitofilin (B, mflkd-2), Mic19/CHCHD3 (C, chchd3kd-2), Mic25/CHCHD6 (D, chchd6kd-3), Mic27/ApoOL (E, apoolkd-2) or Mic23/ApoO (F, apookd-4) were seeded on cover slips, fixed and analyzed using transmission electron microscopy. All cells were induced with doxycycline (Dox) for 7 days, except chchd3kd-2, which was induced for 14 days. Scale bar represents 500 nm. The graphs on the right hand side represent mean values of at least hundred mitochondria counted from two different regions of two different samples ± SD. The mitochondria were divided into two groups, abnormal (Abn.) with circular stacks of inner membrane that appear instead of usual cristae and normal (Norm.) where the usual parallel cristae folds are visible.

