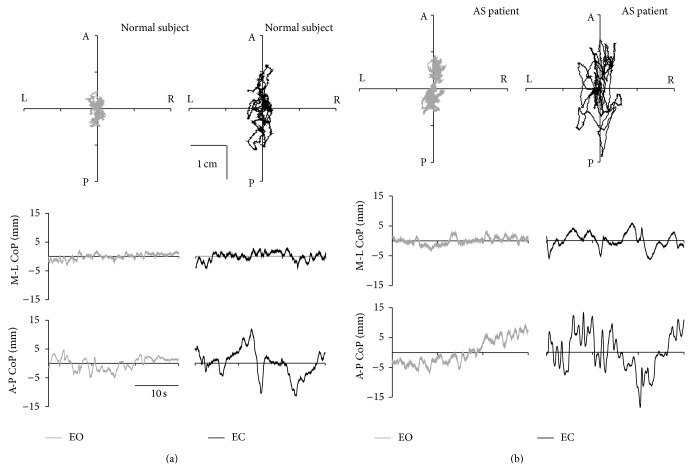
Figure 1.
Statokinesigrams (upper 2D plots of the planar oscillation of the CoP) and stabilograms (lower traces plotted against time) of a normal subject (left half) and an AS patient (right half) plotted during eyes open (EO, gray lines) and eyes closed (EC, black lines). The stabilograms are the projection of the statokinesigram along the mediolateral (M-L, 2nd row plots) and anteroposterior (A-P, 3rd row of plots) directions of the subject. A = anterior, P = posterior, L = left, R = right.

